Overview
- The LabOne Python API
- The Node Concept
- High-speed data streaming
- Introducing the Data Acquisition Module
- Data Acquisition in the User Interface
- LabOne UI Demo for image acquisition
- Automating acquisition with the Python Programming Interface
- Continuous acquistion of data
- Acquistion of 2D data for imaging
The LabOne Python API
- Install with pip:
pip install --upgrade zhinst - The
zhinstmodule contains the actual API (zhinst.ziPython), utility functions (zhinst.utils), and examples (zhinst.examples).
The zhinst module:
import zhinst
help(zhinst)
Running API examples (I)
- Examples can be found under
zhinst.examples
import zhinst.examples
help(zhinst.examples)
Running API examples (II)
- Each example is a separate Python module with a
run_examplemethod
help(zhinst.examples.common.example_connect)
Connecting to the Device
Let's see which device data is available from the device from the API.
To get started, let's import the Zurich Instruments LabOne Python Module and create a connection to the Data Server running on this PC:
import zhinst.ziPython

server_host = 'localhost'
server_port = 8004
api_level = 6
daq = zhinst.ziPython.ziDAQServer(server_host, server_port, api_level)
print('Running LabOne API ', daq.version(), ', ', daq.revision(), sep='')
Then we can connect our device to the Data Server:
dev = 'dev21'
daq.connectDevice(dev, '1gbe')
Device Settings and Data: The Node Tree (1)
The Data Server organises the data and settings in a hierarchical structure called the "node-tree".
Here are the top-level branches for our device:
from zhinst.ziPython import ziListEnum

flags_listNodes = ziListEnum.absolute
node_list = daq.listNodes(f'/{dev}/', flags_listNodes)
print('\n'.join(sorted(node_list)[0:10])); print("...")
Device Settings and Data: The Node Tree (2)
The data and settings are leaves in the node tree:
flags_listNodes = ziListEnum.absolute
demod_node_leaves = daq.listNodes(f'/{dev}/demods/0/', flags_listNodes)
list(sorted(demod_node_leaves))
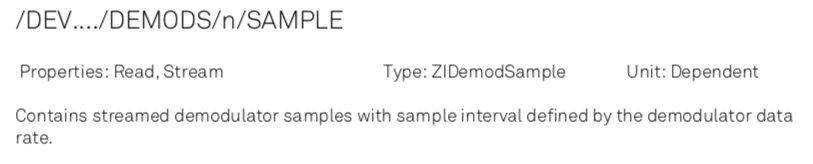
- Using
helpcommand provided by API:
daq.help(f'/{dev}/demods/0/sample')
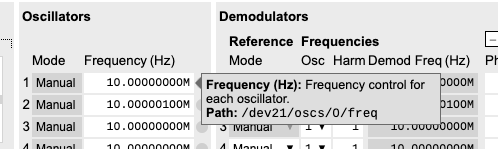
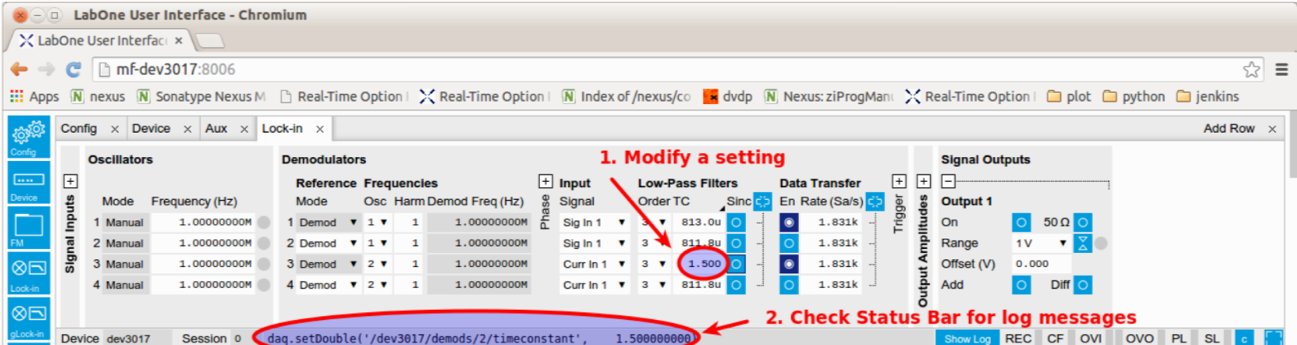
Interactively from the LabOne UI:
Tooltips:
Command log:
Reading Values from Nodes
- Reading single values with
getDouble,getInt,getComplex,getString,getByte- Blocking session until Data Server responds with value
- Reads value cached by Data Server; kept up-to-date by the device pushing up data
daq.getDouble(f'/{dev}/oscs/0/freq')
- Additional commands for special node types:
getSample,getAuxInSample
daq.getSample(f'/{dev}/demods/0/sample')
- Non-blocking variant:
getAsEvent→ result is obtained in nextpoll()command- Request to fetch new data goes down to the device
path = f'/{dev}/oscs/0/freq'
daq.getAsEvent(path)
# Poll until we find path in result data
value = None
while True:
    poll_data = daq.poll(0.1, 100, 0, True)
    if path in poll_data:
        value = poll_data[path]
        break
value
- Higher-level
getsupports wildcards and can return multiple values- Returns cached values if available, otherwise performs read from device
daq.get(f'/{dev}/oscs/*/freq', True)
Setting Values of Nodes
setDouble,setInt,setComplex,setString,setByte- Blocking session until the Data Server returns value
- Synchronous set commands:
syncSetDouble,syncSetInt,syncSetString- Blocking session until the device returns value
- Ensures that data server is in sync with the value on the device
- Setting multiple values:
set([path1, path2, ...]) - Sync command:
sync()- Ensures that pending data is processed and commands are completed
- Flushes all buffers:
poll()data then contains only data obtained after call tosync() - Expensive (~100 ms); often it is sufficient to perform last
setcommand assyncSet...
High Speed Data: ZI's "Streaming" Concept
- Nodes which provide data at high rates are "streaming nodes". Here are all the streaming nodes available on our device:
flags_listNodes = ziListEnum.recursive | ziListEnum.absolute | ziListEnum.streamingonly
node_list = daq.listNodes(f'/{dev}/', flags_listNodes)
node_list = [node for node in node_list if '/0/' in node]
print('\n'.join(sorted(node_list)[0:]));
Obtaining Streaming Data Using the subscribe and poll Commands (1)
import zhinst.utils

# Load a device settings file.
zhinst.utils.load_settings(daq, dev, "./notebook_resources/beat_demod0.xml")

# Subscribe to one or more signals.
daq.subscribe(f'/{dev}/demods/0/sample')
daq.subscribe(f'/{dev}/demods/1/sample')
daq.sync()  # Flush the Data Server's buffers.

# Wait and accumulate data
time.sleep(2.0)

# All the data is returned since the sync() command was executed:
data = daq.poll(0.1, 100, 0, True)
daq.unsubscribe('*')
Obtaining Streaming Data Using the subscribe and poll Commands (2)
- The
datais a dictionary whose entries correspond to the subscribed paths. - The entries are also dictionaries which contain the fields of a demodulator sample.
- Each field of the demodulator sample is a numpy array.
data.keys()
demod_path = f'/{dev}/demods/0/sample'
data[demod_path].keys()
ts = data[demod_path]['timestamp']
x = data[demod_path]['x']
y = data[demod_path]['y']
R = np.abs(x + 1j*y)
Obtaining Streaming Data Using the subscribe and poll Commands (3)
fig, ax = plt.subplots(figsize=(7,4))
clockbase = daq.getInt(f'/{dev}/clockbase')
plt.plot((ts - ts[0]) / clockbase, R)
plt.xlabel('Time (s)'); plt.ylabel(r'Amplitude ($V_{rms}$)');

The Data returned by the subscribe and poll Method
- These nodes typically provide data at a tact that is ultimately defined by the instrument's ADCs.

- The sample points from these nodes might not have common timestamps → interpolation required.
- Poll does not guarentee that the data is aligned → for continuous acquisition, book-keeping is required.
- Previously,
subscribe()andpoll()commands were the only way to obtain continuous data from the device, now they are only recommended when extremely high performance is required.
LabOne API Modules
- Modules: high-level software components, which are common to all APIs
- Each module has its own API connection (session) to the data server
- Modules use an asynchronous (non-blocking) interface; they run in an own thread on the PC
- Examples: Sweeper, DAQ, Scope, AWG, etc.
The Data Acquisition (DAQ) Module
The Data Acquistion (DAQ) Module:
- Offers functionality analogous to that of lab oscilloscopes.
- Provides continuous or triggered data acquisition.
- Aligns data.
- Reduces the amount of data saved to disk.
- Simultaneously acquires time and frequency domain data.
The Data Acquisition Module was introduced in LabOne Release 17.12. It combines and improves the Software Trigger Module and the Spectrum Modules.
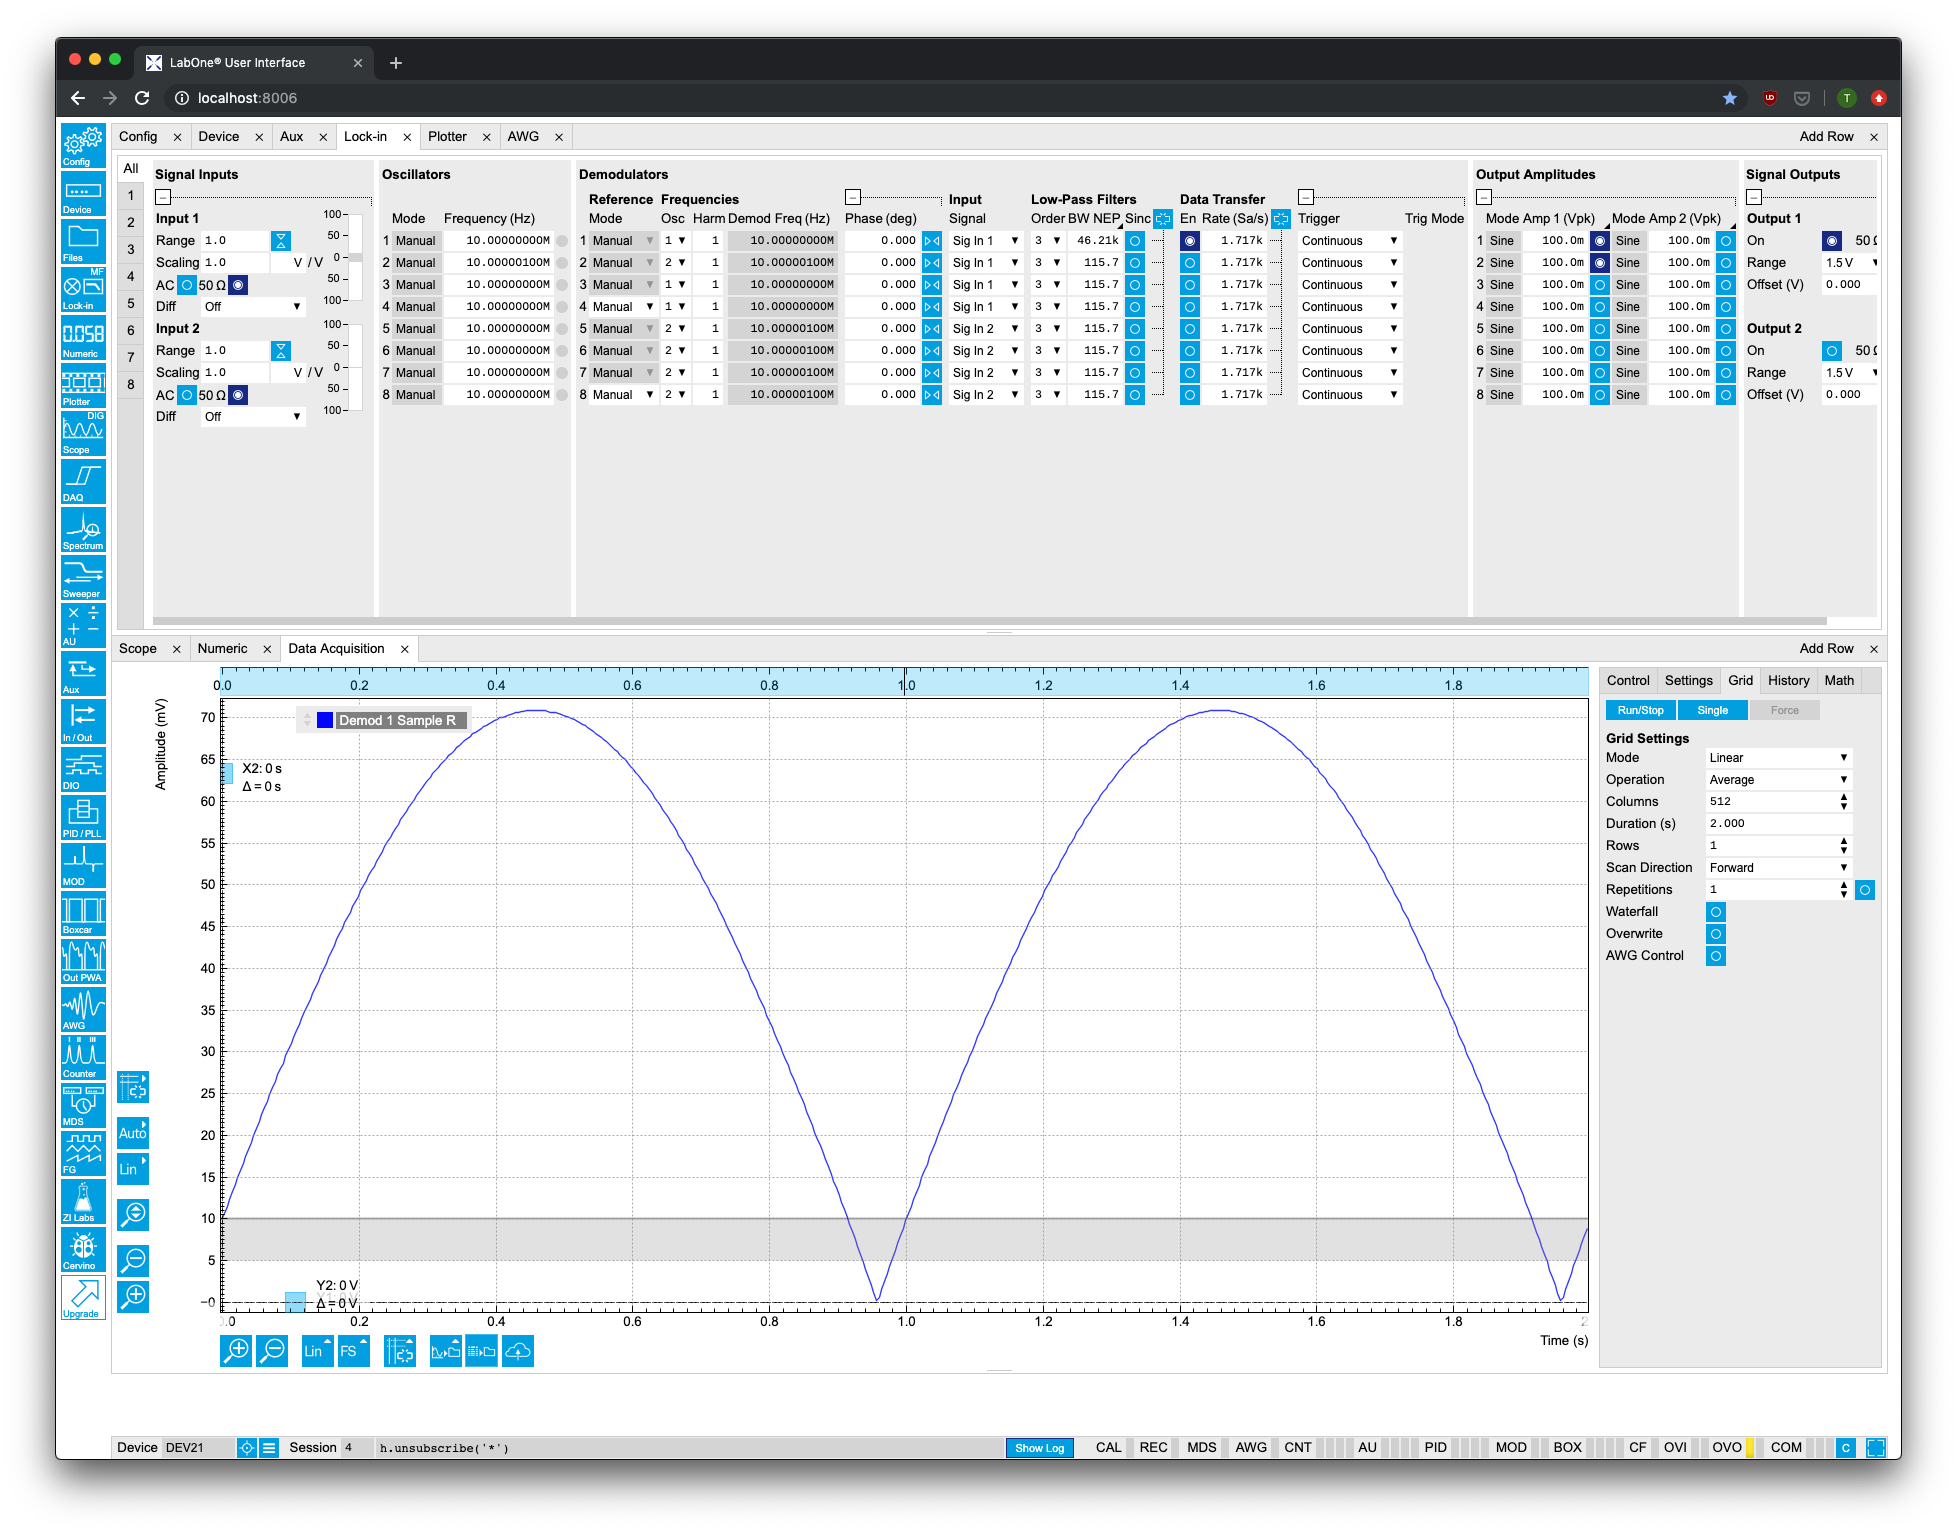
UI Demo
Let's have a look at the DAQ Module in the LabOne UI …
- Configure instance of a DAQ module from LabOne user interface:
- Settings → Trigger Level = 10 mV
- Settings → Hysteresis = 5 mV
- Grid → Mode = Linear
- Grid → Duration = 2 s
- Observe API command log to see how the module was configured.
Continuous Recording with the DAQ Module (1)
Initialise and configure the DAQ Module.
h = daq.dataAcquisitionModule()
sampling_rate = 1000  # Number of points/second
total_duration = 10   # Time in seconds
burst_duration = 0.2  # Time in seconds for each data burst/segment.
num_cols = int(np.ceil(sampling_rate * burst_duration))
num_bursts = int(np.ceil(total_duration / burst_duration))

h.set('dataAcquisitionModule/device', dev)
h.set('dataAcquisitionModule/type', 0)  # Specify continuous acquisition.
h.set('dataAcquisitionModule/count', num_bursts)
h.set('dataAcquisitionModule/duration', burst_duration)
h.set('dataAcquisitionModule/grid/mode', 2) # Linearly interpolate the data.
h.set('dataAcquisitionModule/grid/cols', num_cols)
We subscribe in the module to the data we're interested in.
node_path = f'/{dev}/demods/0/sample.r.avg'
h.subscribe(node_path)
Continuous Recording with the DAQ Module (3)
We first define a simple helper routine for plotting. Here we use the module read() function to read data out from the module. It returns data in a similar format to that of poll().
def read_data_update_plot(timestamp0):
    prog = 100 * h.progress()[0]
    ax.set_title("Progress of data acquisition: {:.2f}%.".format(prog))
    data = h.read(True)
    if node_path in data:
        if np.isnan(timestamp0):
            # Remember timestamp from start of acquisition.
            timestamp0 = data[node_path][0]['timestamp'][0, 0]
        for d in data[node_path]:
            t = (d['timestamp'][0, :] - timestamp0) / clockbase
            plt.plot(t, d['value'][0, :])
        fig.canvas.draw()
    return timestamp0
Continuous Recording with the DAQ Module (4)
h.execute()  # Start the acquisition.
ts0 = np.nan; plt.show()
while not h.finished():
    time.sleep(0.1)
    ts0 = read_data_update_plot(ts0)
read_data_update_plot(ts0);

Image Recording with the DAQ Module (1)
First we'll setup a UHFLI with AWG option:
- Copy the AWG wave file
static/notebook_resources/zi_logo_grey_8bit.csvto theZurich Instruments LabOne/WebServer/awg/waves/user subdirectory. - AWG Tab: Upload the sequencer program
static/notebook_resources/image_generator_daqmodule.seqc - Config Tab: Load the device XML settings file
static/notebook_resources/image_generator_daqmodule.xml
Image Recording with the DAQ Module (2)
h = daq.dataAcquisitionModule()
delay = -0.0001
duration = 0.0015

h.set('dataAcquisitionModule/device', dev)
h.set('dataAcquisitionModule/type', 6)        # Specify AWG Trigger type.
h.set('dataAcquisitionModule/awgcontrol', 1)  # Use AWG control.
h.set('dataAcquisitionModule/count', 1)       # 1 image.
h.set('dataAcquisitionModule/edge', 1)        # Positive edge.
h.set('dataAcquisitionModule/eventcount/mode', 1)
h.set('dataAcquisitionModule/delay', delay)
h.set('dataAcquisitionModule/grid/mode', 2)
h.set('dataAcquisitionModule/grid/cols', 256)
h.set('dataAcquisitionModule/grid/rows', 256)
h.set('dataAcquisitionModule/grid/repetitions', 1)
h.set('dataAcquisitionModule/duration', duration)
h.set('dataAcquisitionModule/holdoff/time', 0)
h.set('dataAcquisitionModule/holdoff/count', 0)

triggernode = f'/{dev}/demods/0/sample.TrigAWGTrig1'
h.set('dataAcquisitionModule/triggernode', triggernode)
h.subscribe(f'/{dev}/demods/0/sample.R.avg')
Image Recording with the DAQ Module (3)
R = data[f'/{dev}/demods/0/sample.r.avg'][0]['value']
im = plt.imshow(R, aspect='equal', origin='lower')
fig.colorbar(im); plt.show()

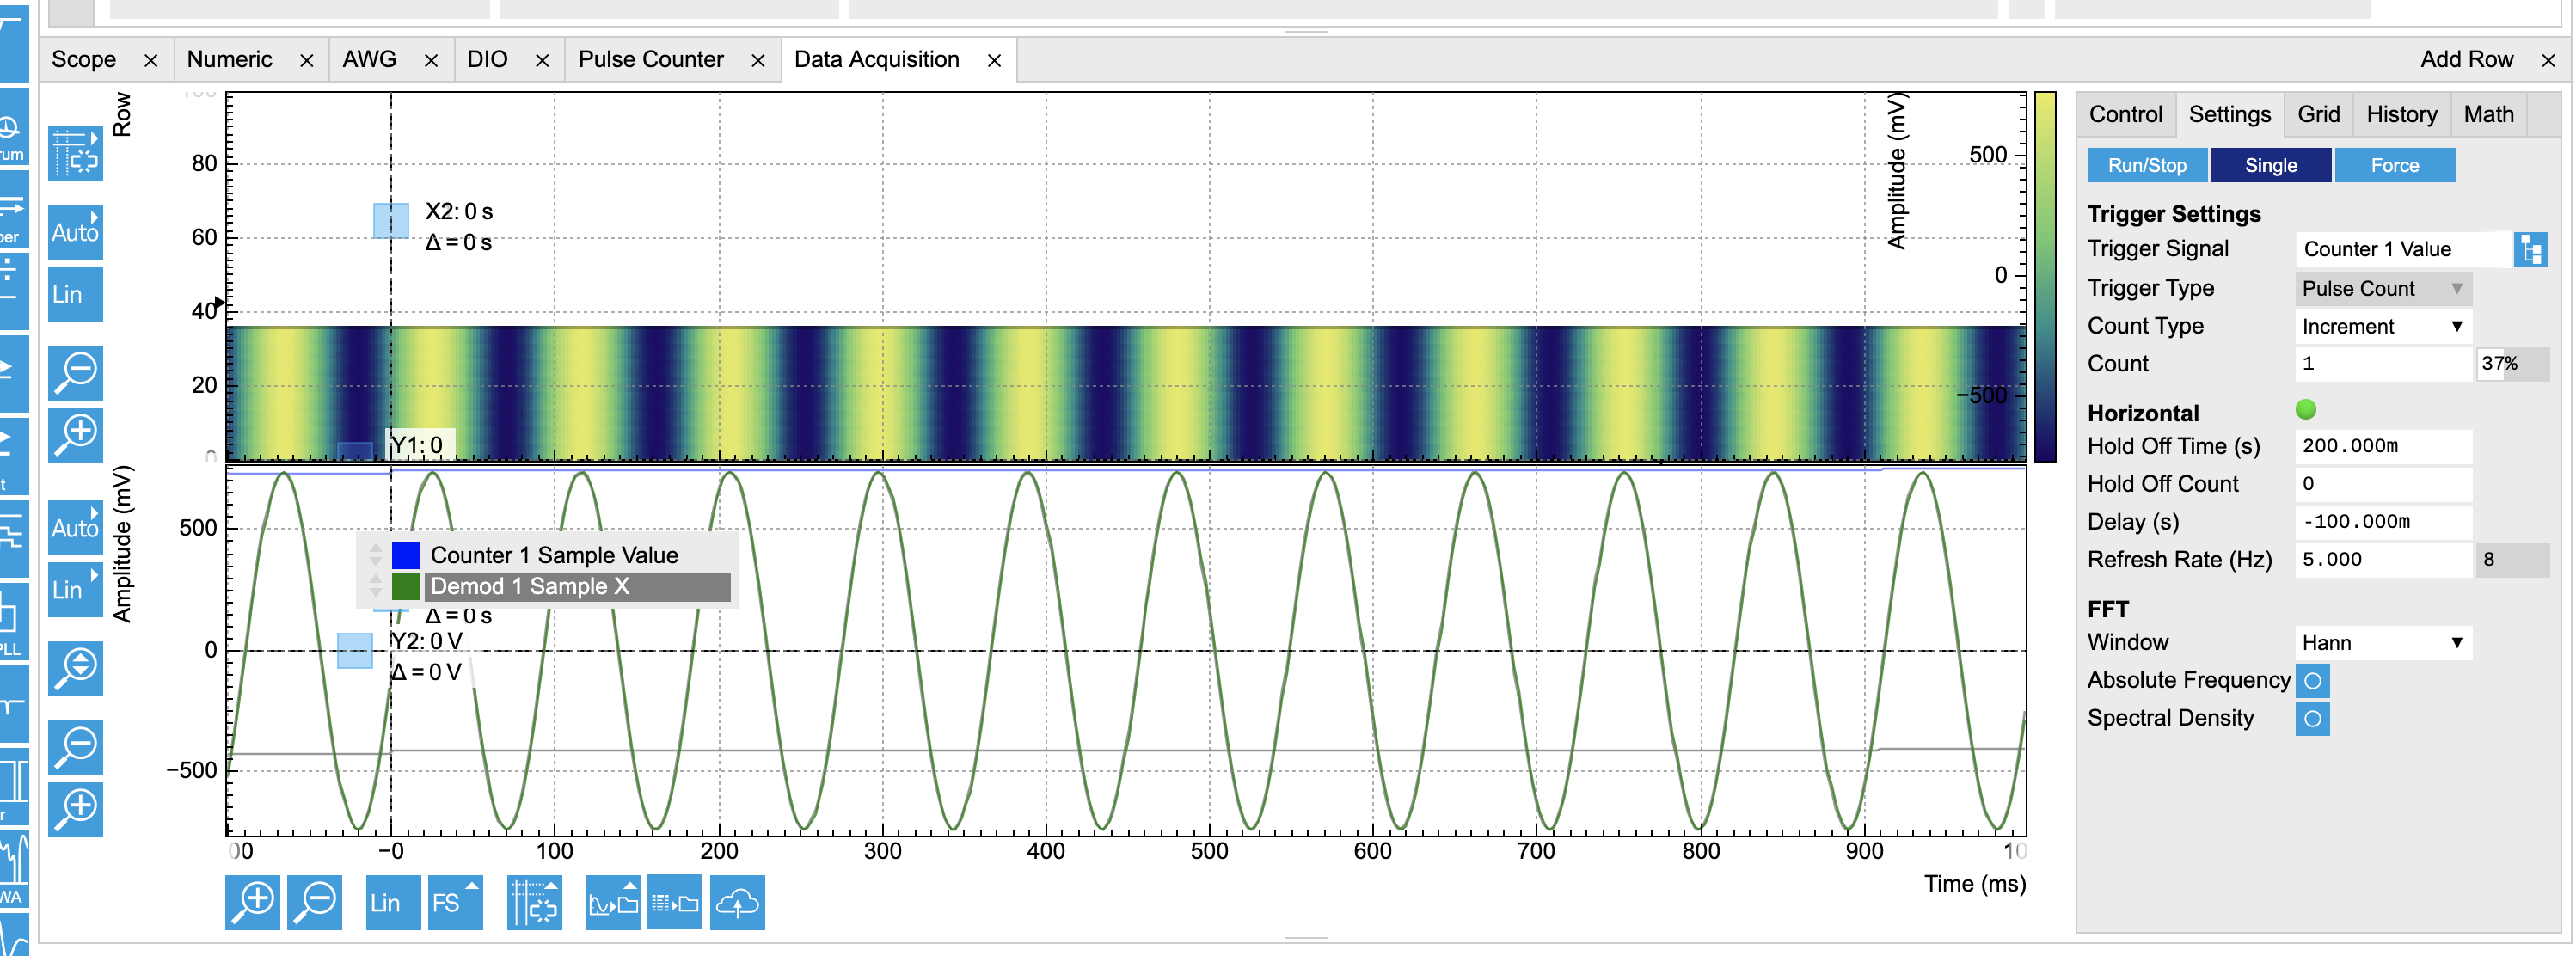
Bonus: Setting up DAQ module for acquisition with line clock
- SPM controllers can often provide a line clock output, which has a high level for a short time (typ. ~10 µs) during each scan line.
- Config Tab: Load the device XML settings file
static/notebook_resources/settings_uhf_dig_trigger_daq.xml - Load AWG program
const N = 200000;
const N_pulse = 2;

wave signal = sine(N, 0, 10);
wave pulse = join(ones(N_pulse), zeros(N - N_pulse));

while (true) {
  playWave(signal, pulse);
}- Connect Signal Output 1 to Signal Input 1; and Signal Output 2 to Ref/Trig 1.
- The program outputs a sine on output 1, and a ~10 us pulse on output 2.
- The Pulse Counter is used to increment the a counter value on each pulse.
- DAQ trigger is set to Pulse Counter value increment.
Screenshot